How to monitor Deis Workflow with Sysdig Cloud
Deis Workflow is an open source Platform as a Service that works with and compliments Kubernetes. This is great if you want a Heroku-inspired workflow for easily deploying your container-based apps to the cloud.
But what if you want to monitor them as well and get insight into app performance? That's where Sysdig Cloud comes in.
Sysdig Cloud is "container-native monitoring". It comes with built in integration for many popular server software products, gives you a realtime dashboard, historical replay, dynamic topology mapping, and alerting. It also natively integrates with Kubernetes so that you can monitor your services as well as your containers and hosts.
So let's combine these two products!
In this post I am going to show you how to monitor Deis Workflow with Sysdig Cloud.
Setup
Firstly you need to create a trial Sysdig account.
Once you're signed up, log in, and you should see the welcome screen:
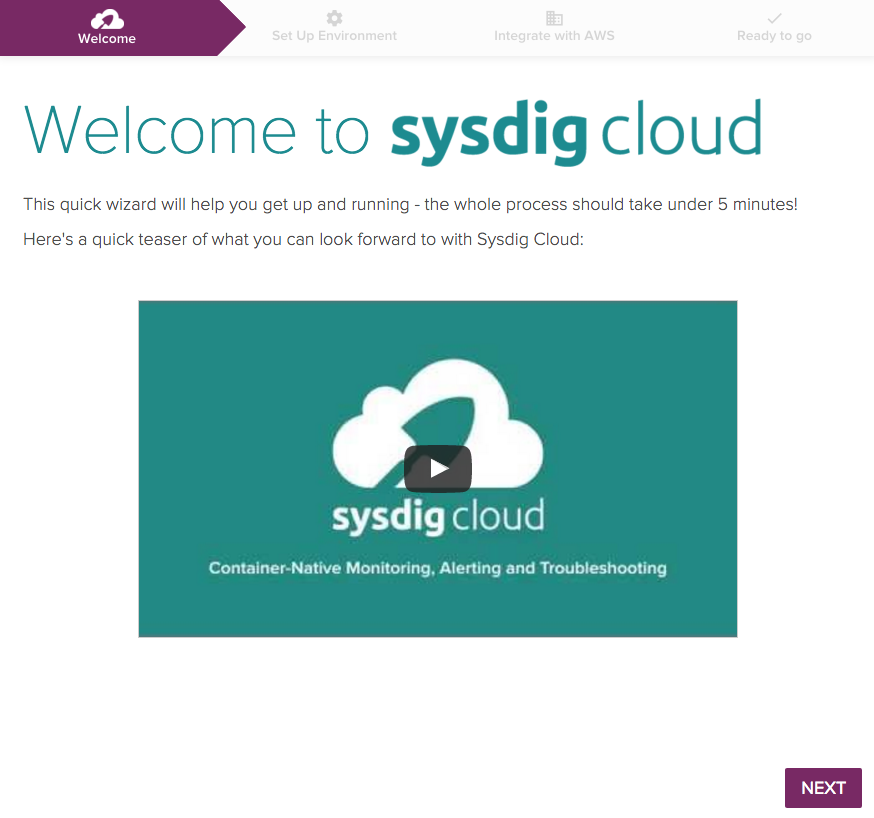
From this screen, you can watch a short video explaining Sysdig cloud.
Select Next and you should see:
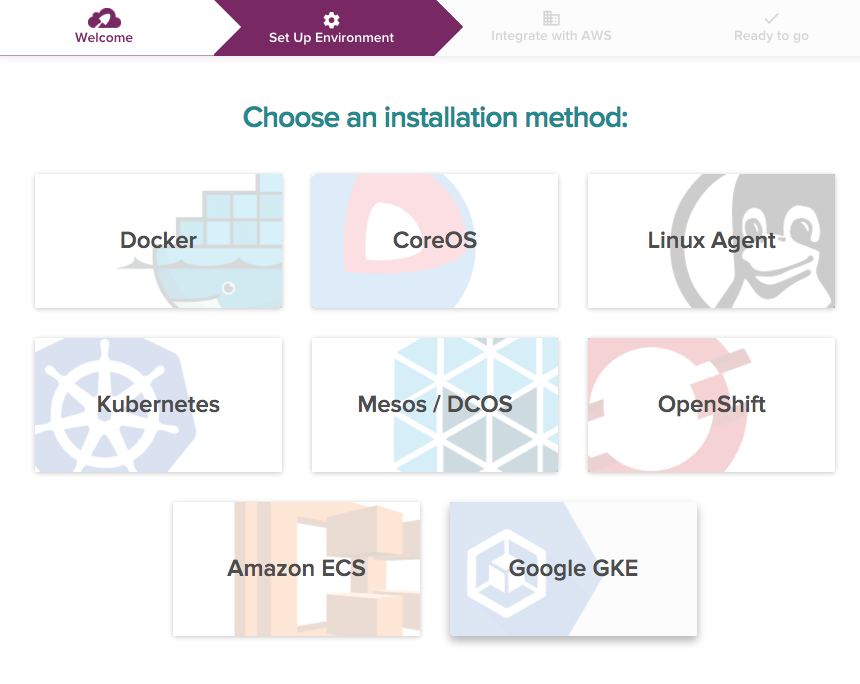
The second screen prompts you to choose an installation method. In this post, we are going to use a Google GKE Kubernetes setup. So, select Google GKE.
The next screen will look like this:
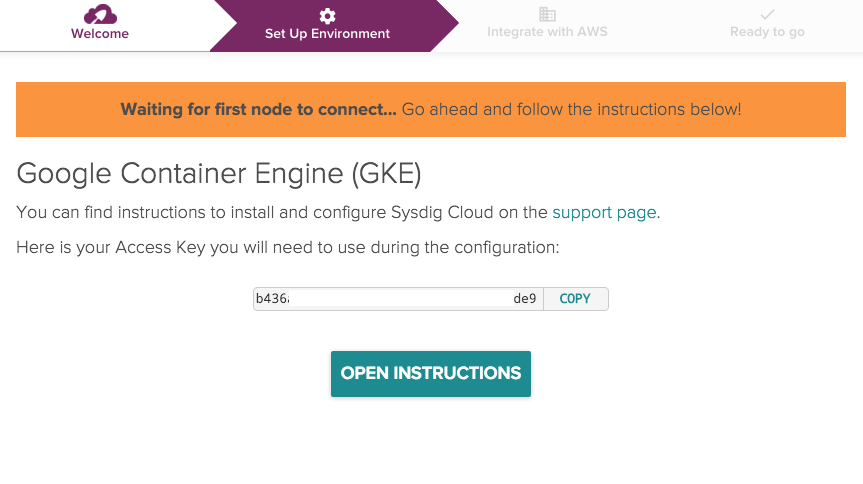
You can read instructions how to setup Sysdig Cloud monitoring agent in your GKE environment by selecting Open Instructions, or download this sysdig-daemonset.yaml file and updating it with your Sysdig Access Key shown above.
The daemon set YAML file is recommended way to install the Sysdig agent, so we'll document what to do with that file.
After updating the file with your Sysdig Access Key, run:
$ kubectl create -f sysdig-daemonset.yaml
daemonset "sysdig-agent" created
Check the daemon set was deployed:
$ kubectl get ds sysdig-agent
NAME           DESIRED   CURRENT   NODE-SELECTOR   AGE
sysdig-agent   3         3         <none>          1m
The Sysdig Cloud website will wait for the agents running in your GKE environment to connect to Sysdig Cloud. Once they have done so, your page will refresh, and should see something like this:
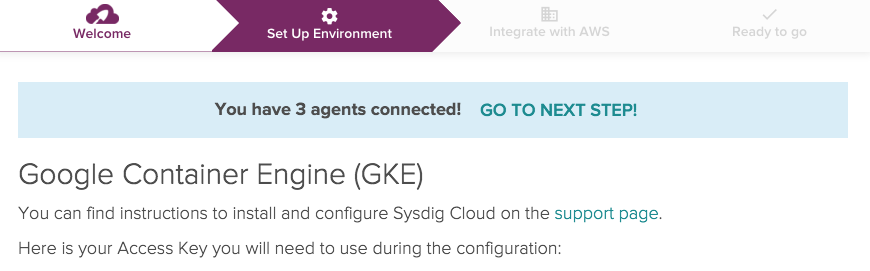
The blue status message tells us there are three GKE nodes and with Sysdig agents installed and detected by Sysdig Cloud. At this point Sysdig Cloud has also located and integrated with the Kubernetes master in Google Cloud.
Select GO TO NEXT STEP in the blue box. This will take you to the Integrate with AWS step. Skip that by selecting NEXT, and you will get to the Ready to go step. Here you can watch videos introducing a few Sysdig Cloud features.
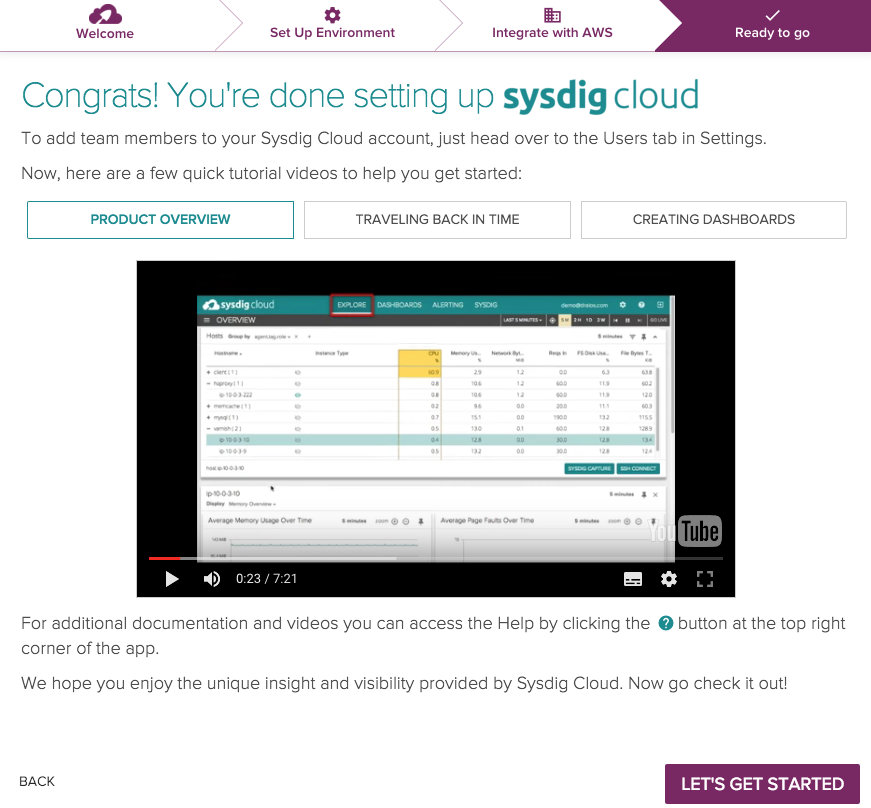
Select LET'S GET STARTED. This will launch the Sysdig Cloud dashboard.
Sysdig Cloud Dashboard
When Sysdig Cloud launches, it will look like this:
On the Overview screen, we can see the list of our running GKE VMs.
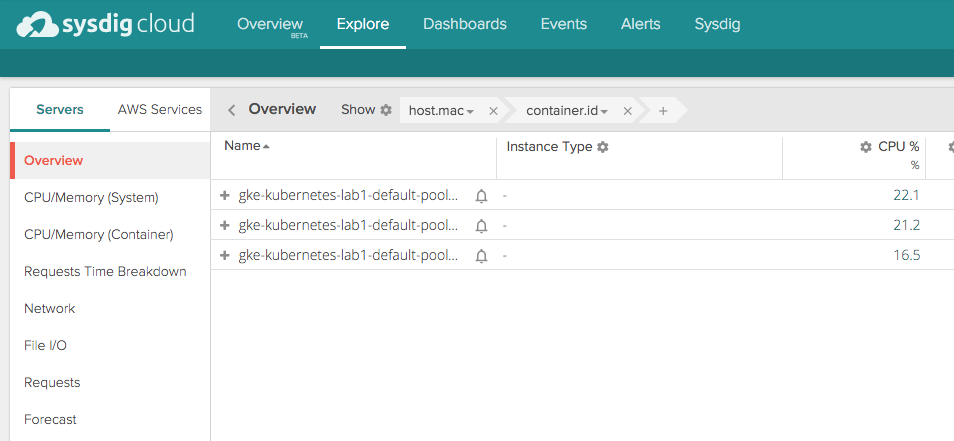
You can select items on the left nav column to switch between different metrics, such as CPU usage, network, File I/O, and so on. You can also select any row in the table to get a deeper dive into host resources, top processes running, network utilization, and more.
At this point, our GKE cluster has monitoring set up, and Sysdig Cloud is already collecting data. We should already see some data here. But this data is going to be even more interesting after we install Deis Workflow and launch a demo an app.
So let's do that now.
Follow this Deis tutorial to get Deis Workflow installed. And when you get to the Deploying Applications section, skip to the DOCKERFILE APPLICATION subsection and follow the instructions to get a demo app deployed.
Once you've done both of these things, return to this post, and we can take a look at the data we collected.
Set Up Your Dashboards
Creating Dashboards for Hosts and Containers
Let's add our GKE nodes to a dashboard so we can easily find them when we need to.
We can do this by selecting the Dashboards tab from the top menu, and then selecting the New button next to My Dashboards section in the nav column on the left.
Once you've done this, you should get a New Dashboard Wizard. Scroll down this screen until you see the Hosts & Containers section, then select Overview by Container section. Leave the Scope set to "Everywhere" and set the Name to "Containers".
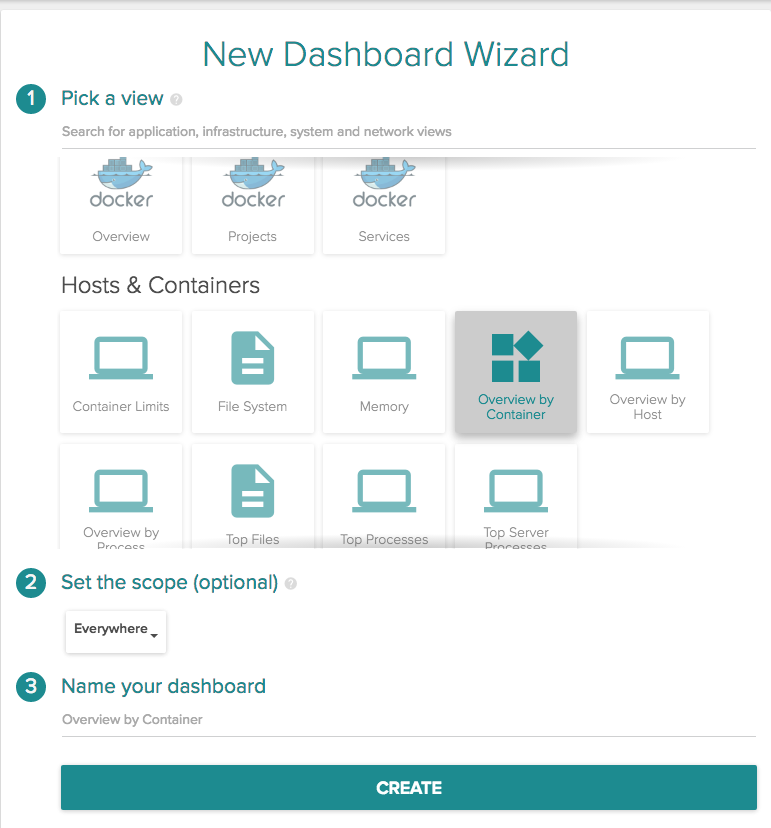
Next, repeat the same for Overview by Host:
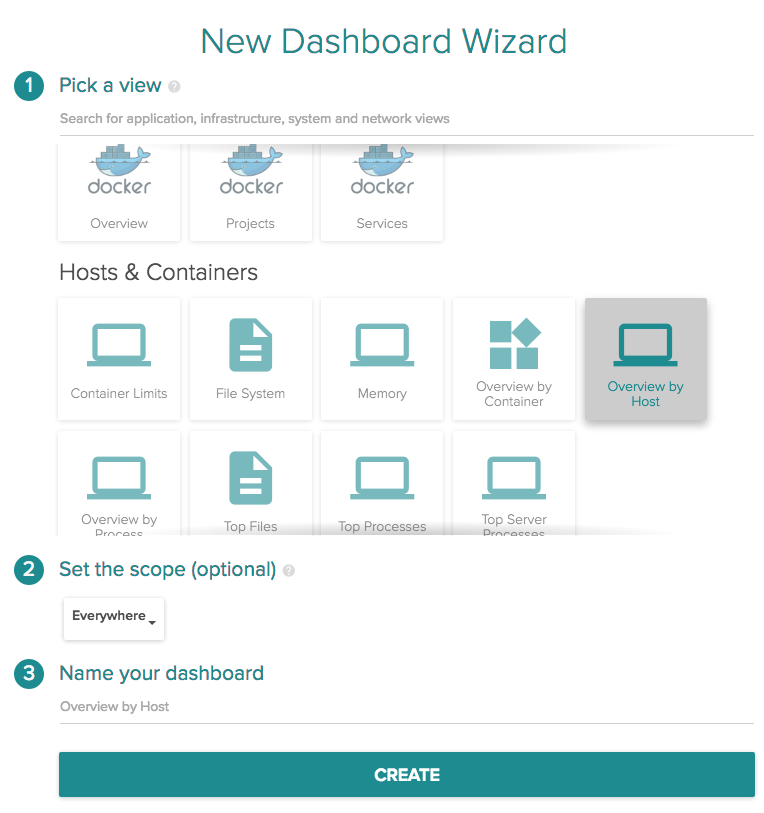
Cool. We've created two dashboards. One for Hosts where we can see our VMs. And another one for Containers, which will show us containers running on Kubernetes.
Creating Dashboards for Deis and Guestbook
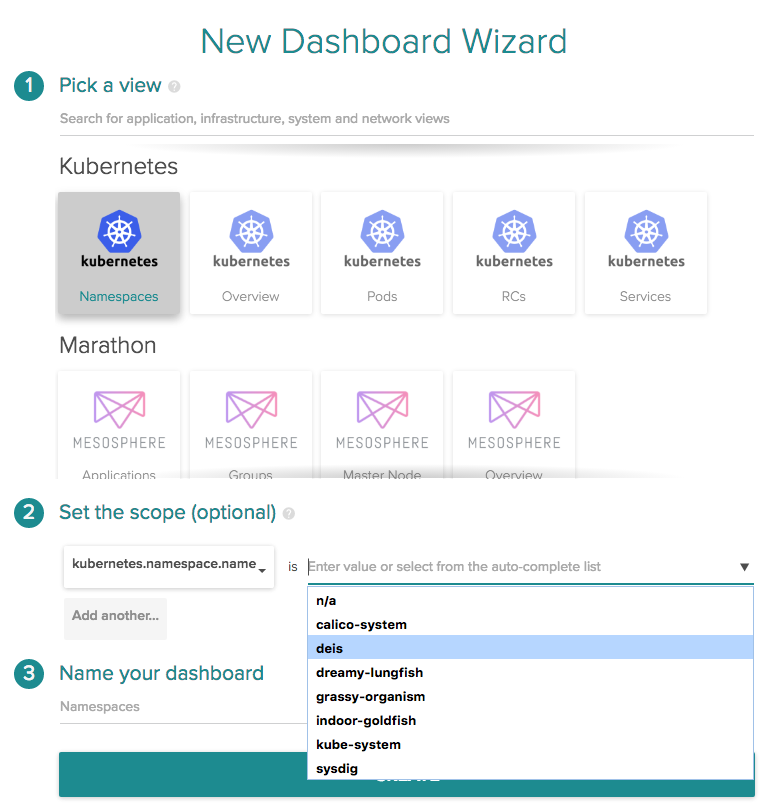
Let's add dashboards for each Kubernetes namespaces we want to monitor:
- Deis: for the
deisnamespace, used by Deis Workflow - Guestbook: for the
guestbooknamespace, used by our demo app
Scroll down in New Dashboard Wizard to Kubernetes and select Set the scope.
Type "namespace" to get an autocomplete menu. Then pick kubernetes.namespace.name from the menu that pops up. On the right, type "deis" and select the deis namespace. Then, move to the next section and name the dashboard "Deis".
This will let us monitor Deis Workflow related containers.
Repeat the same for the guestbook namespace, and name the dashboard "Guestbook App". This will let us monitor containers being used by our guestbook application.
Checking the Dashboards
After completing all this, you should have four dashboards:
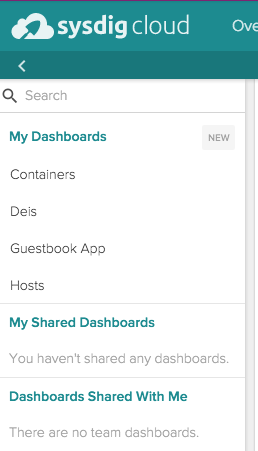
The dashboard list shows everything in alphabetical order. But we are going to look at them one by one, using an order that makes more sense for us.
The Hosts Dashboard
Let's start with the Hosts dashboard.
Click on Hosts, and you should see something that looks like this:
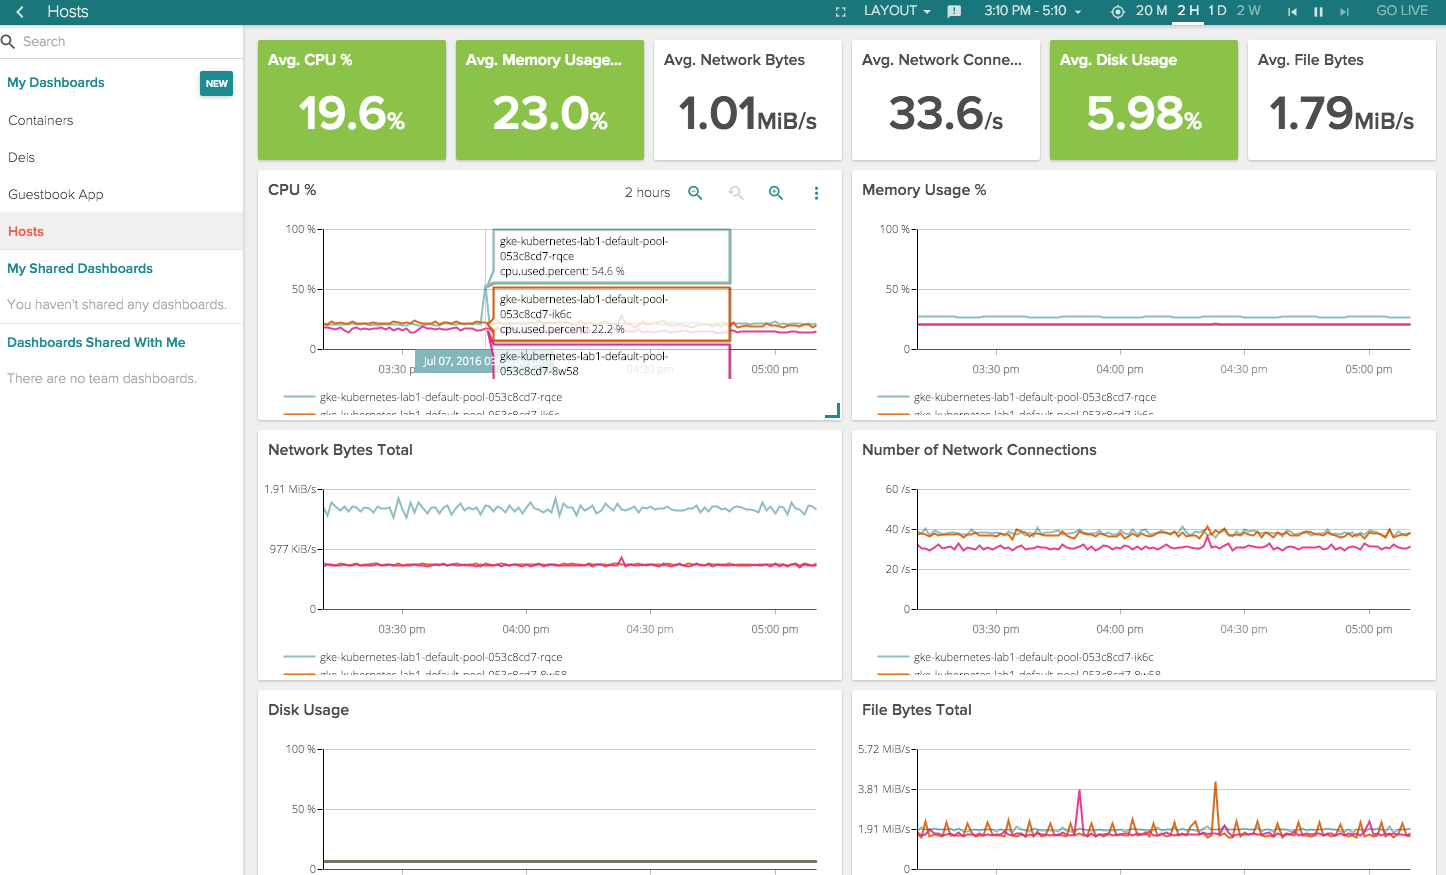
At the top of the screen, some average usage stats for our GKE VMs is shown.
Under CPU we see a peek of usage. Hovering over this with the cursor brings up more details about what happened at each point in time.
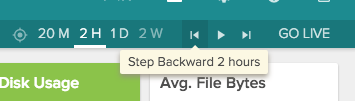
In the top right corner you will see some time controls, like so:

Selecting the back and forward arrows lets you see the stats as they were at different points in time. And if you select GO LIVE, you can see realtime stats!
The Containers Dashboard
Next, select the Containers dashboard and you'll see something like this:
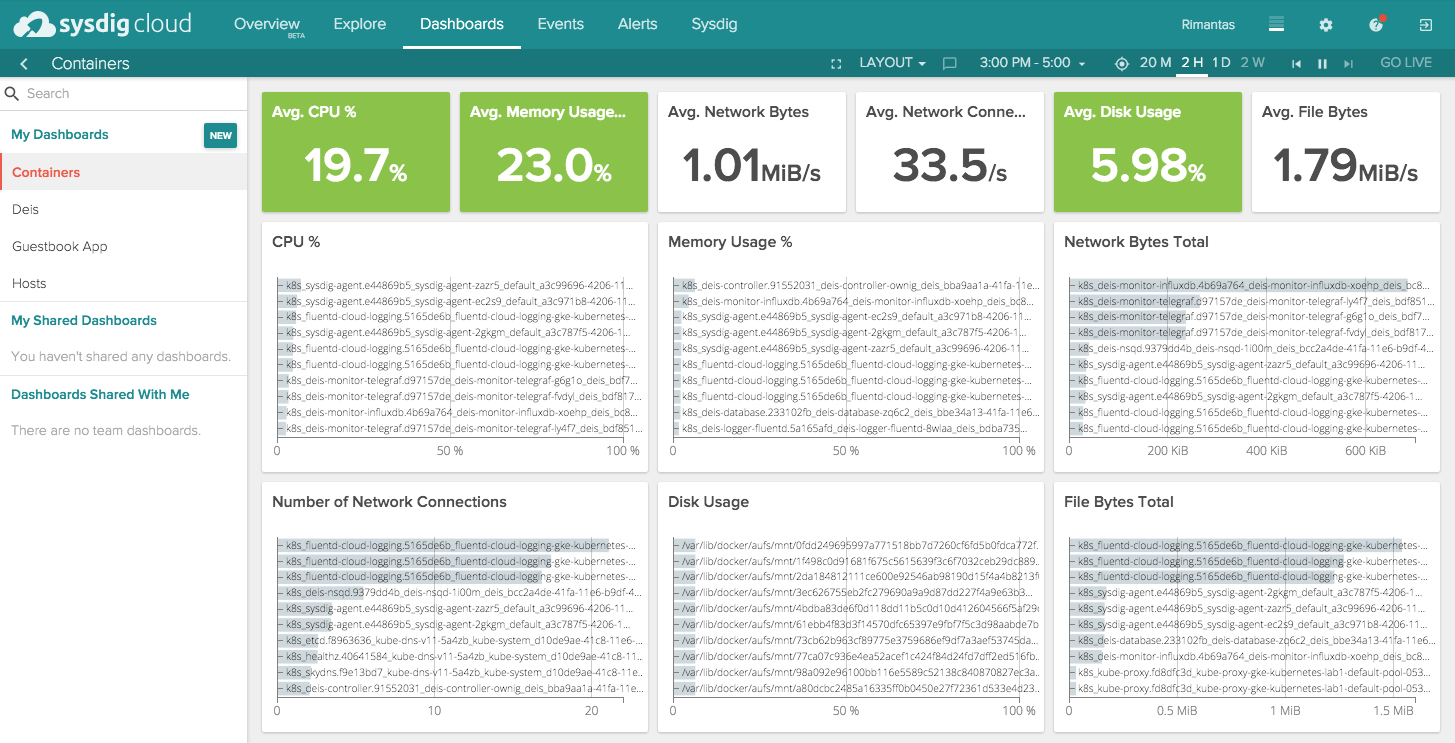
At the top we have some average container resource usage stats.
Below this, we see a number of boxes for each stat type, with each container represented on a bar graph. The containers using the most resources will appear in the top-most position on each bar graph.
The Deis Dashboard
Okay, let's move on and see how Deis Workflow is performing.
Deis Workflow by itself is not very power hungry. Most of the time it sleeps. Only the router is continually working, routing external traffic to your Deis apps. But even that will not use much of your GKE cluster resources.
Workflow got busy when you added your app, however. Specifically, the builder took your Dockerfile and built the app, using some of your GKE resources.
So, let's see if we can see that in Sysdig Cloud.
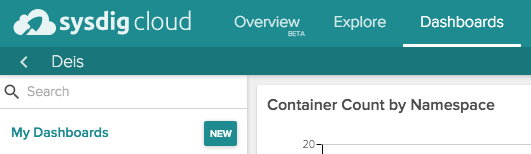
Select the Deis dashboard to get something like this:
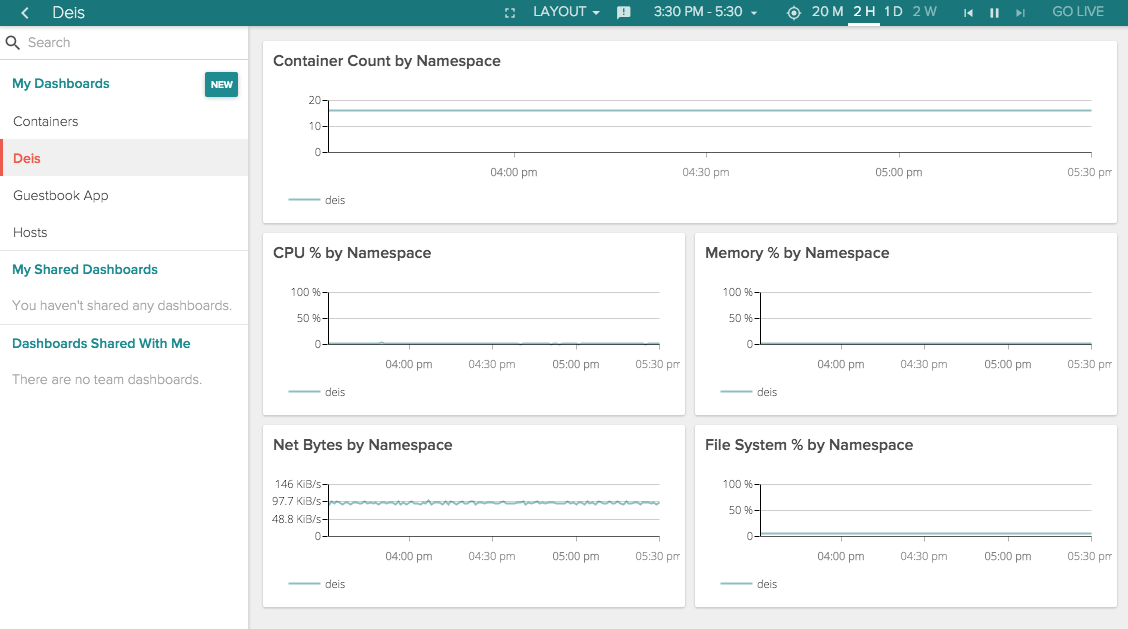
As we can see, nothing much is currently happening.
But let's check it out what was happening when we were building our guestbook app from the Dockerfile with git push deis master.
Click the backwards button:
Here, we see the spot we're looking for:
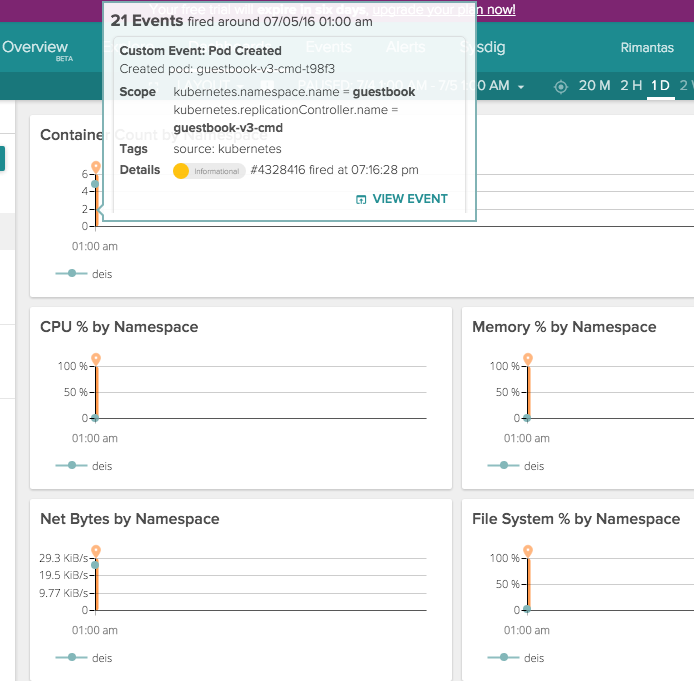
That spike in resources corresponds to work Deis did for you.
The Guestbook App Dashboard
Let's scale our guestbook app so we can see what happens in Sysdig Cloud:
$ deis scale cmd=50 -a guestbook
Give this a few minutes to run.
Now, open the Guestbook App dashboard:
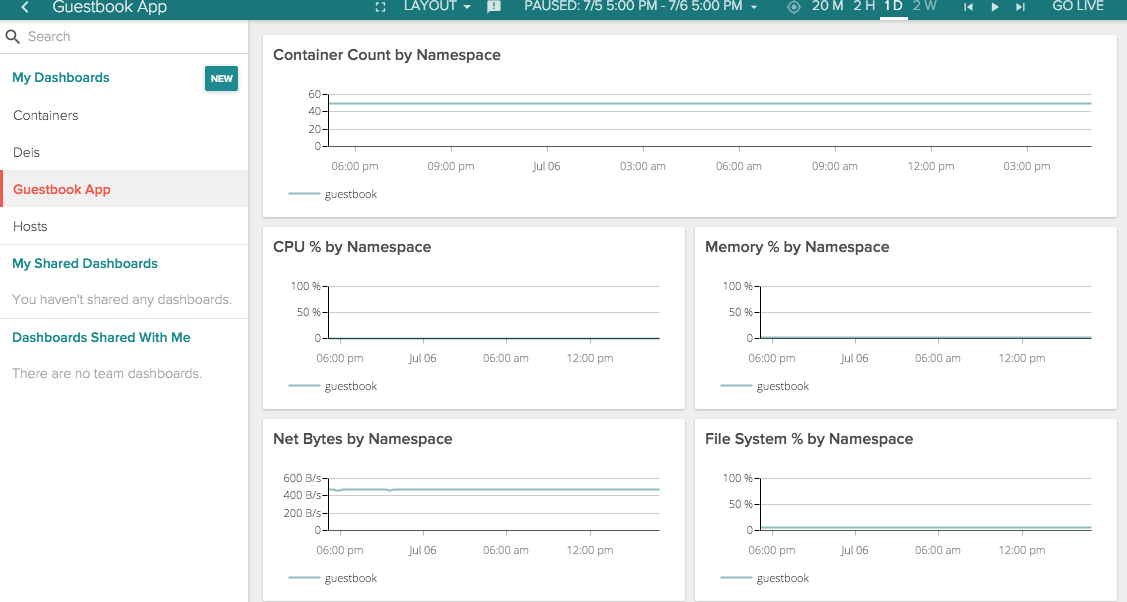
Looking at the top graph, we can see that our app is running 50 containers.
Stress Testing
Before we wrap up, let's see what things look like under stress.
I am going to use ApacheBench to do my testing. But you can use whatever tool you wish.
Here, I ran the ab command to generate some traffic:
$ while sleep 1; do ab -n 5000 -c 100 http://guestbook.rimusz.net/;done
This is ApacheBench, Version 2.3 <$Revision: 655654 $>

Benchmarking website (be patient)
Completed 500 requests
...
Finished 5000 requests

Server Software:        nginx/1.10.1
Server Hostname:        guestbook.rimusz.net
Server Port:            80

Document Path:          /
Document Length:        921 bytes

Concurrency Level:      100
Time taken for tests:   18.084 seconds
Complete requests:      5000
Failed requests:        0
Write errors:           0
Total transferred:      6025000 bytes
HTML transferred:       4605000 bytes
Requests per second:    276.49 [#/sec] (mean)
Time per request:       361.672 [ms] (mean)
Time per request:       3.617 [ms] (mean, across all concurrent requests)
Transfer rate:          325.37 [Kbytes/sec] received
...

Percentage of the requests served within a certain time (ms)
  50%    154
  ...
 100%  10019 (longest request)
...
Leave that command running for a while.
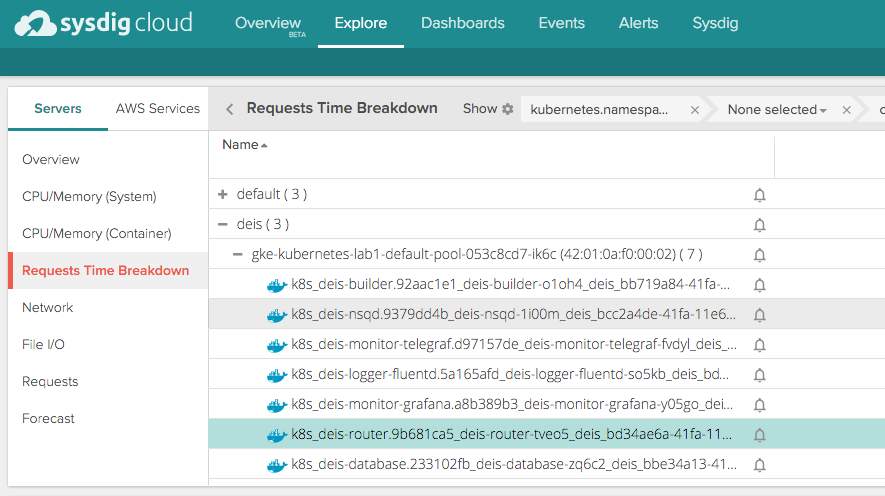
Now. Let's take a look at what our request time looks like.
Select Explore, Servers, Requests Breakdown, and then deis(3). From the list of containers, find the one with a name that starts with k8s_deis-router. This is our router.
Scroll down a bit, and from the left Views menu, scroll to Kubernetes, and select Services:
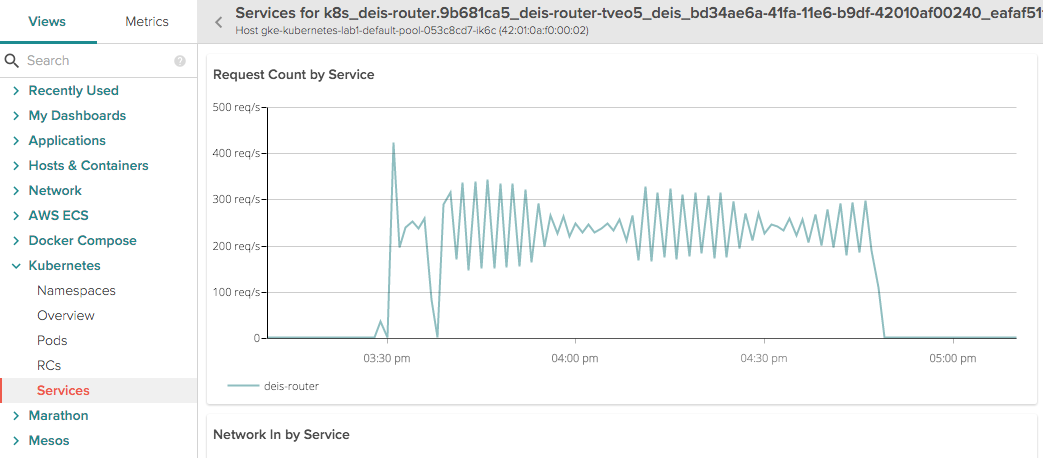
Here we see the number of requests per second peaked just above 400 and then varied for a period of over one hour.
Scroll to the right a little and you'll see this:
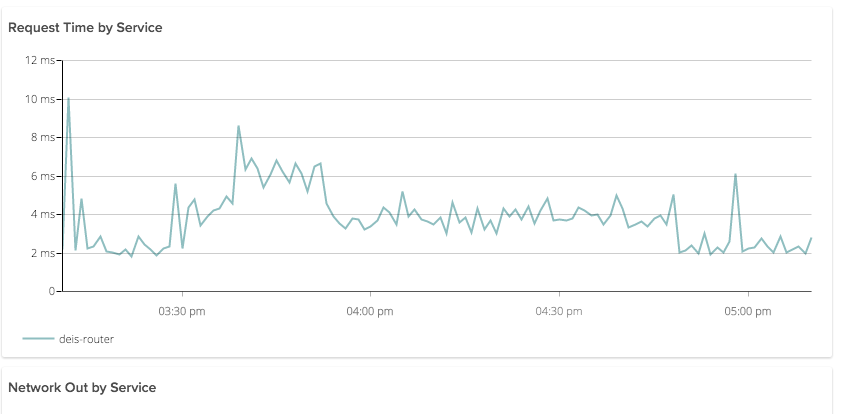
In this graph, we see how the request time varied over time.
Wrap Up
In this blog post we have learned how to setup Sysdig Cloud to monitor our GKE Kubernetes cluster, get Deis Workflow installed, and deploy a demo guestbook app. We then stress tested the app to see how it would perform.
Using the features of Sysdig Cloud, including historical rewind, we were able to inspect (and graph) the various system properties of our cluster that map to these events.
Of course, this is just the start of what you can do with Sysdig Cloud. If you want to know more, head over to the docs, or start your free trial today.
